

Data visualisation is a compelling way to communicate trends and inspire strategic thinking. At McCrindle, I worked with a diverse client base – ranging from PR agencies and major consumer brands, to government organisations and not-for-profits.
Above are a few snapshots of infographics and visual reports I designed, based on research conducted by McCrindle.
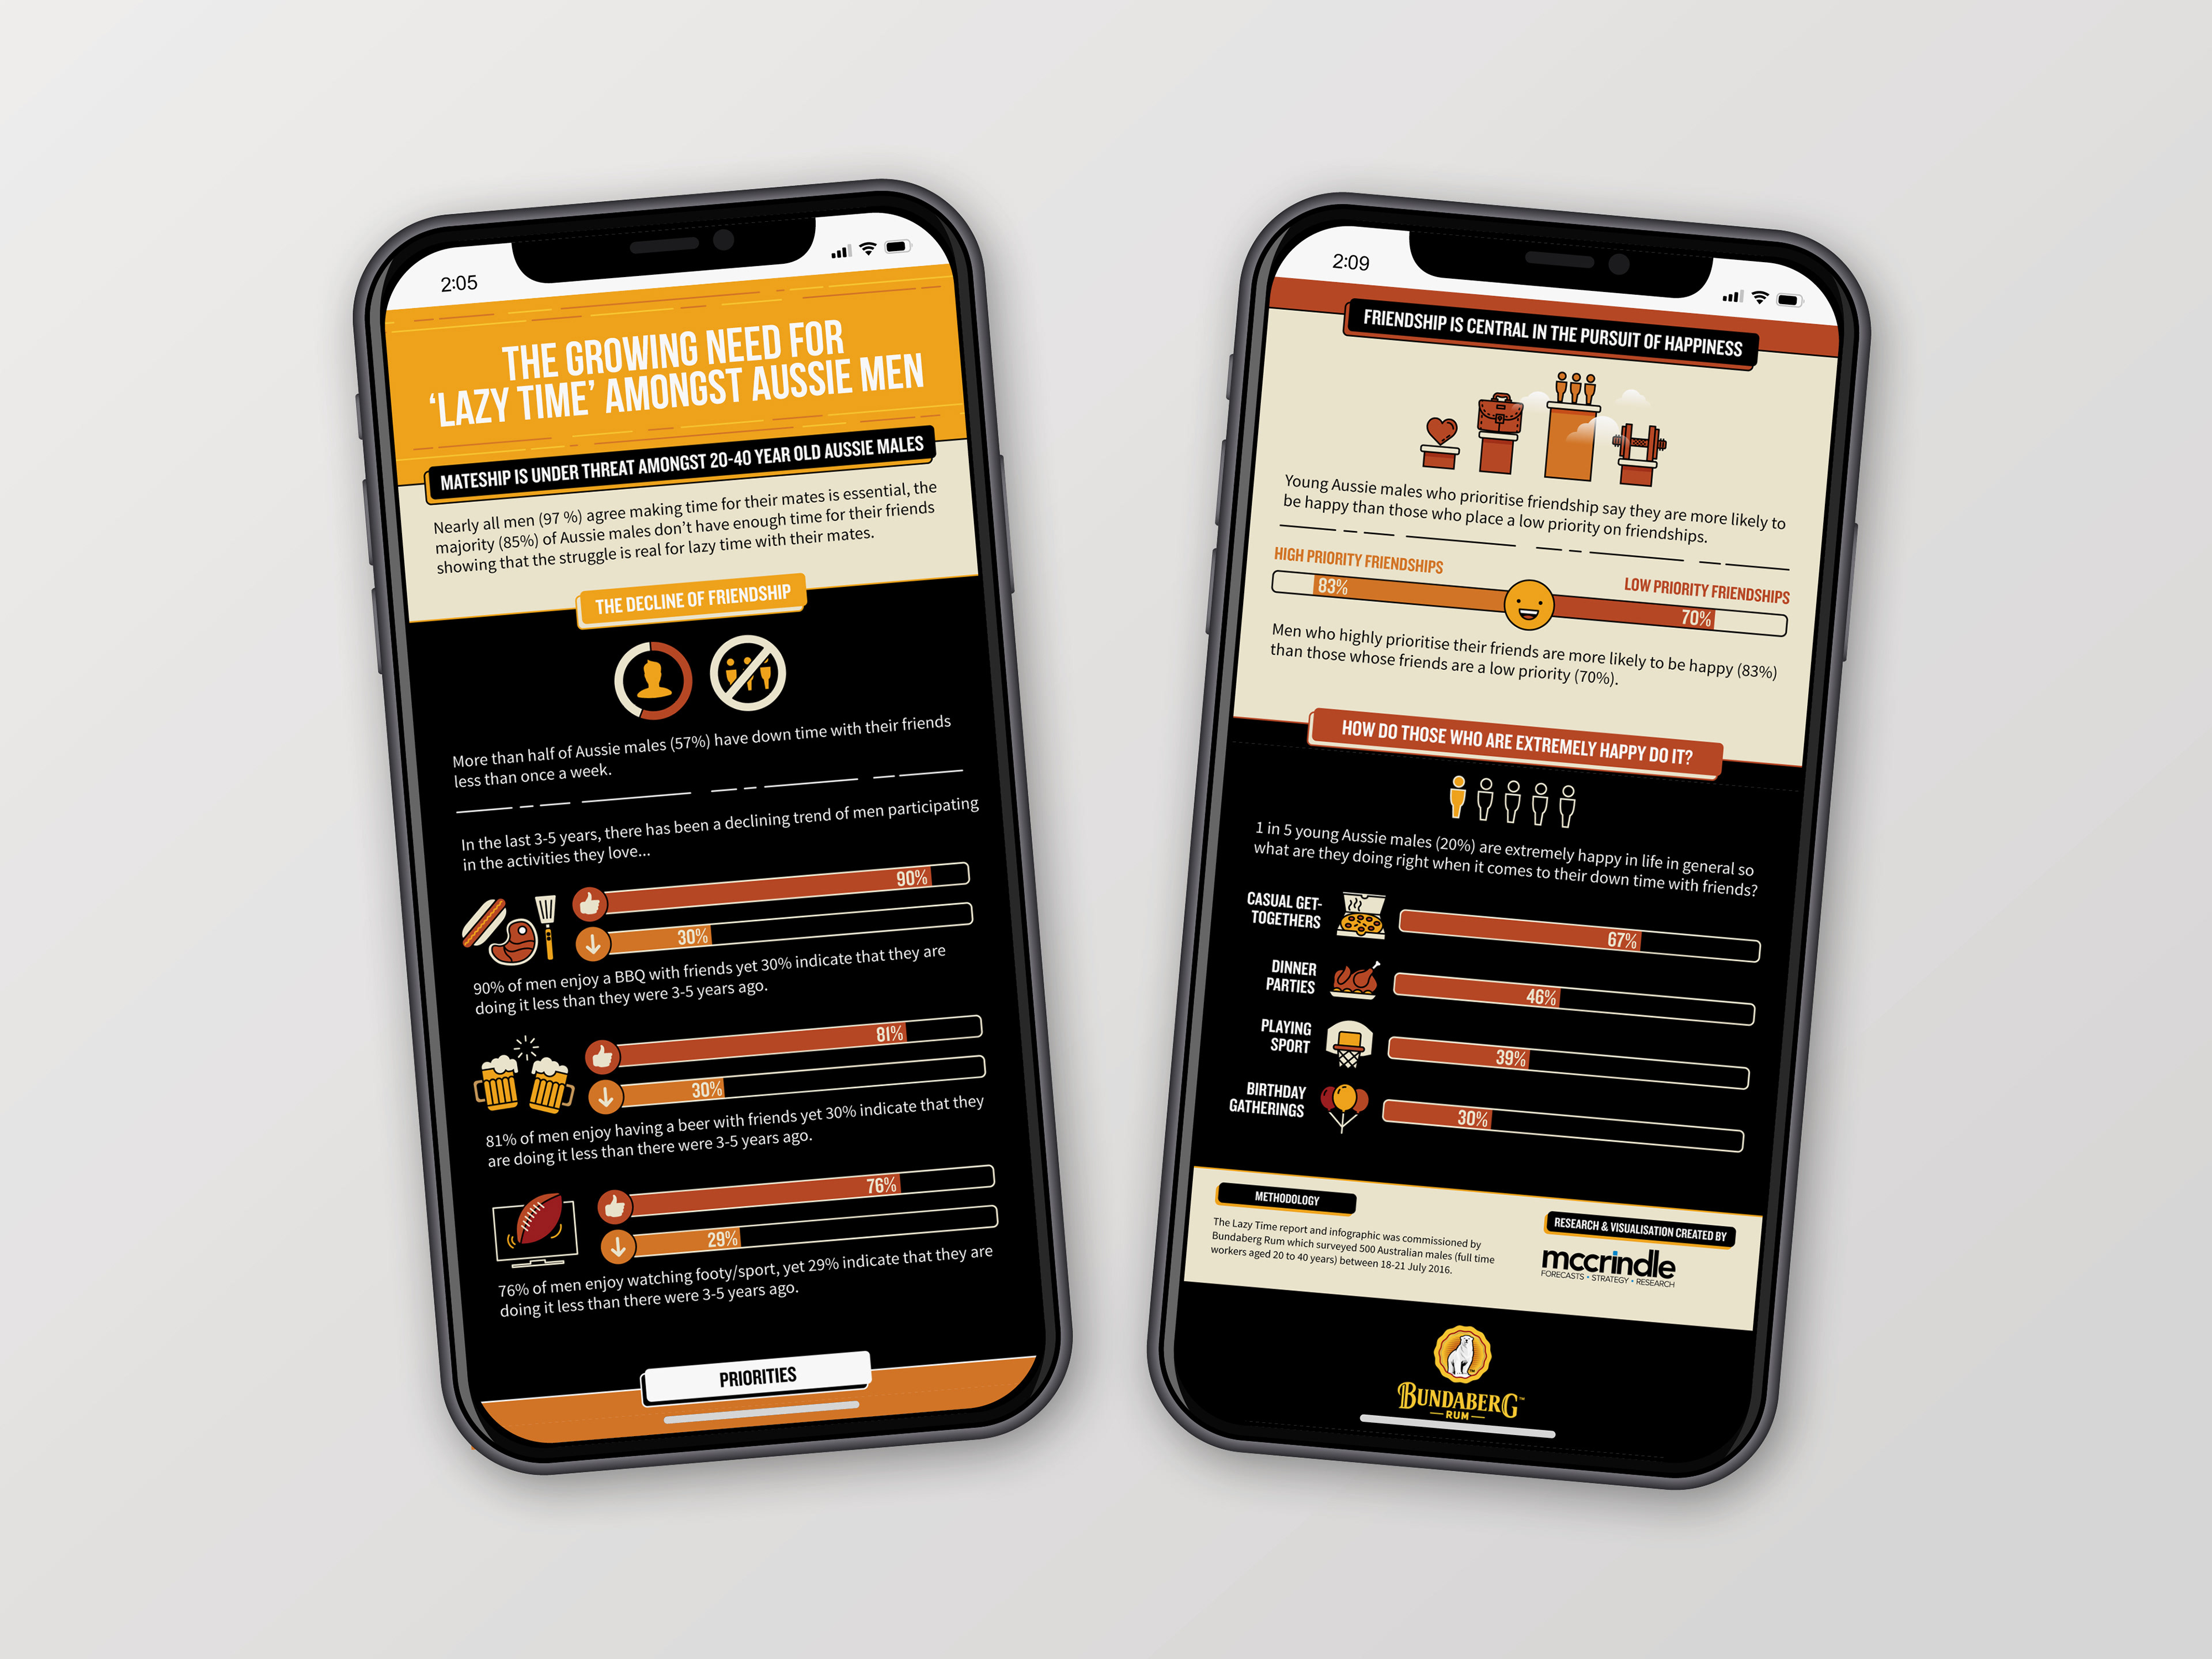
1 Bundaberg Rum: Lazy Time
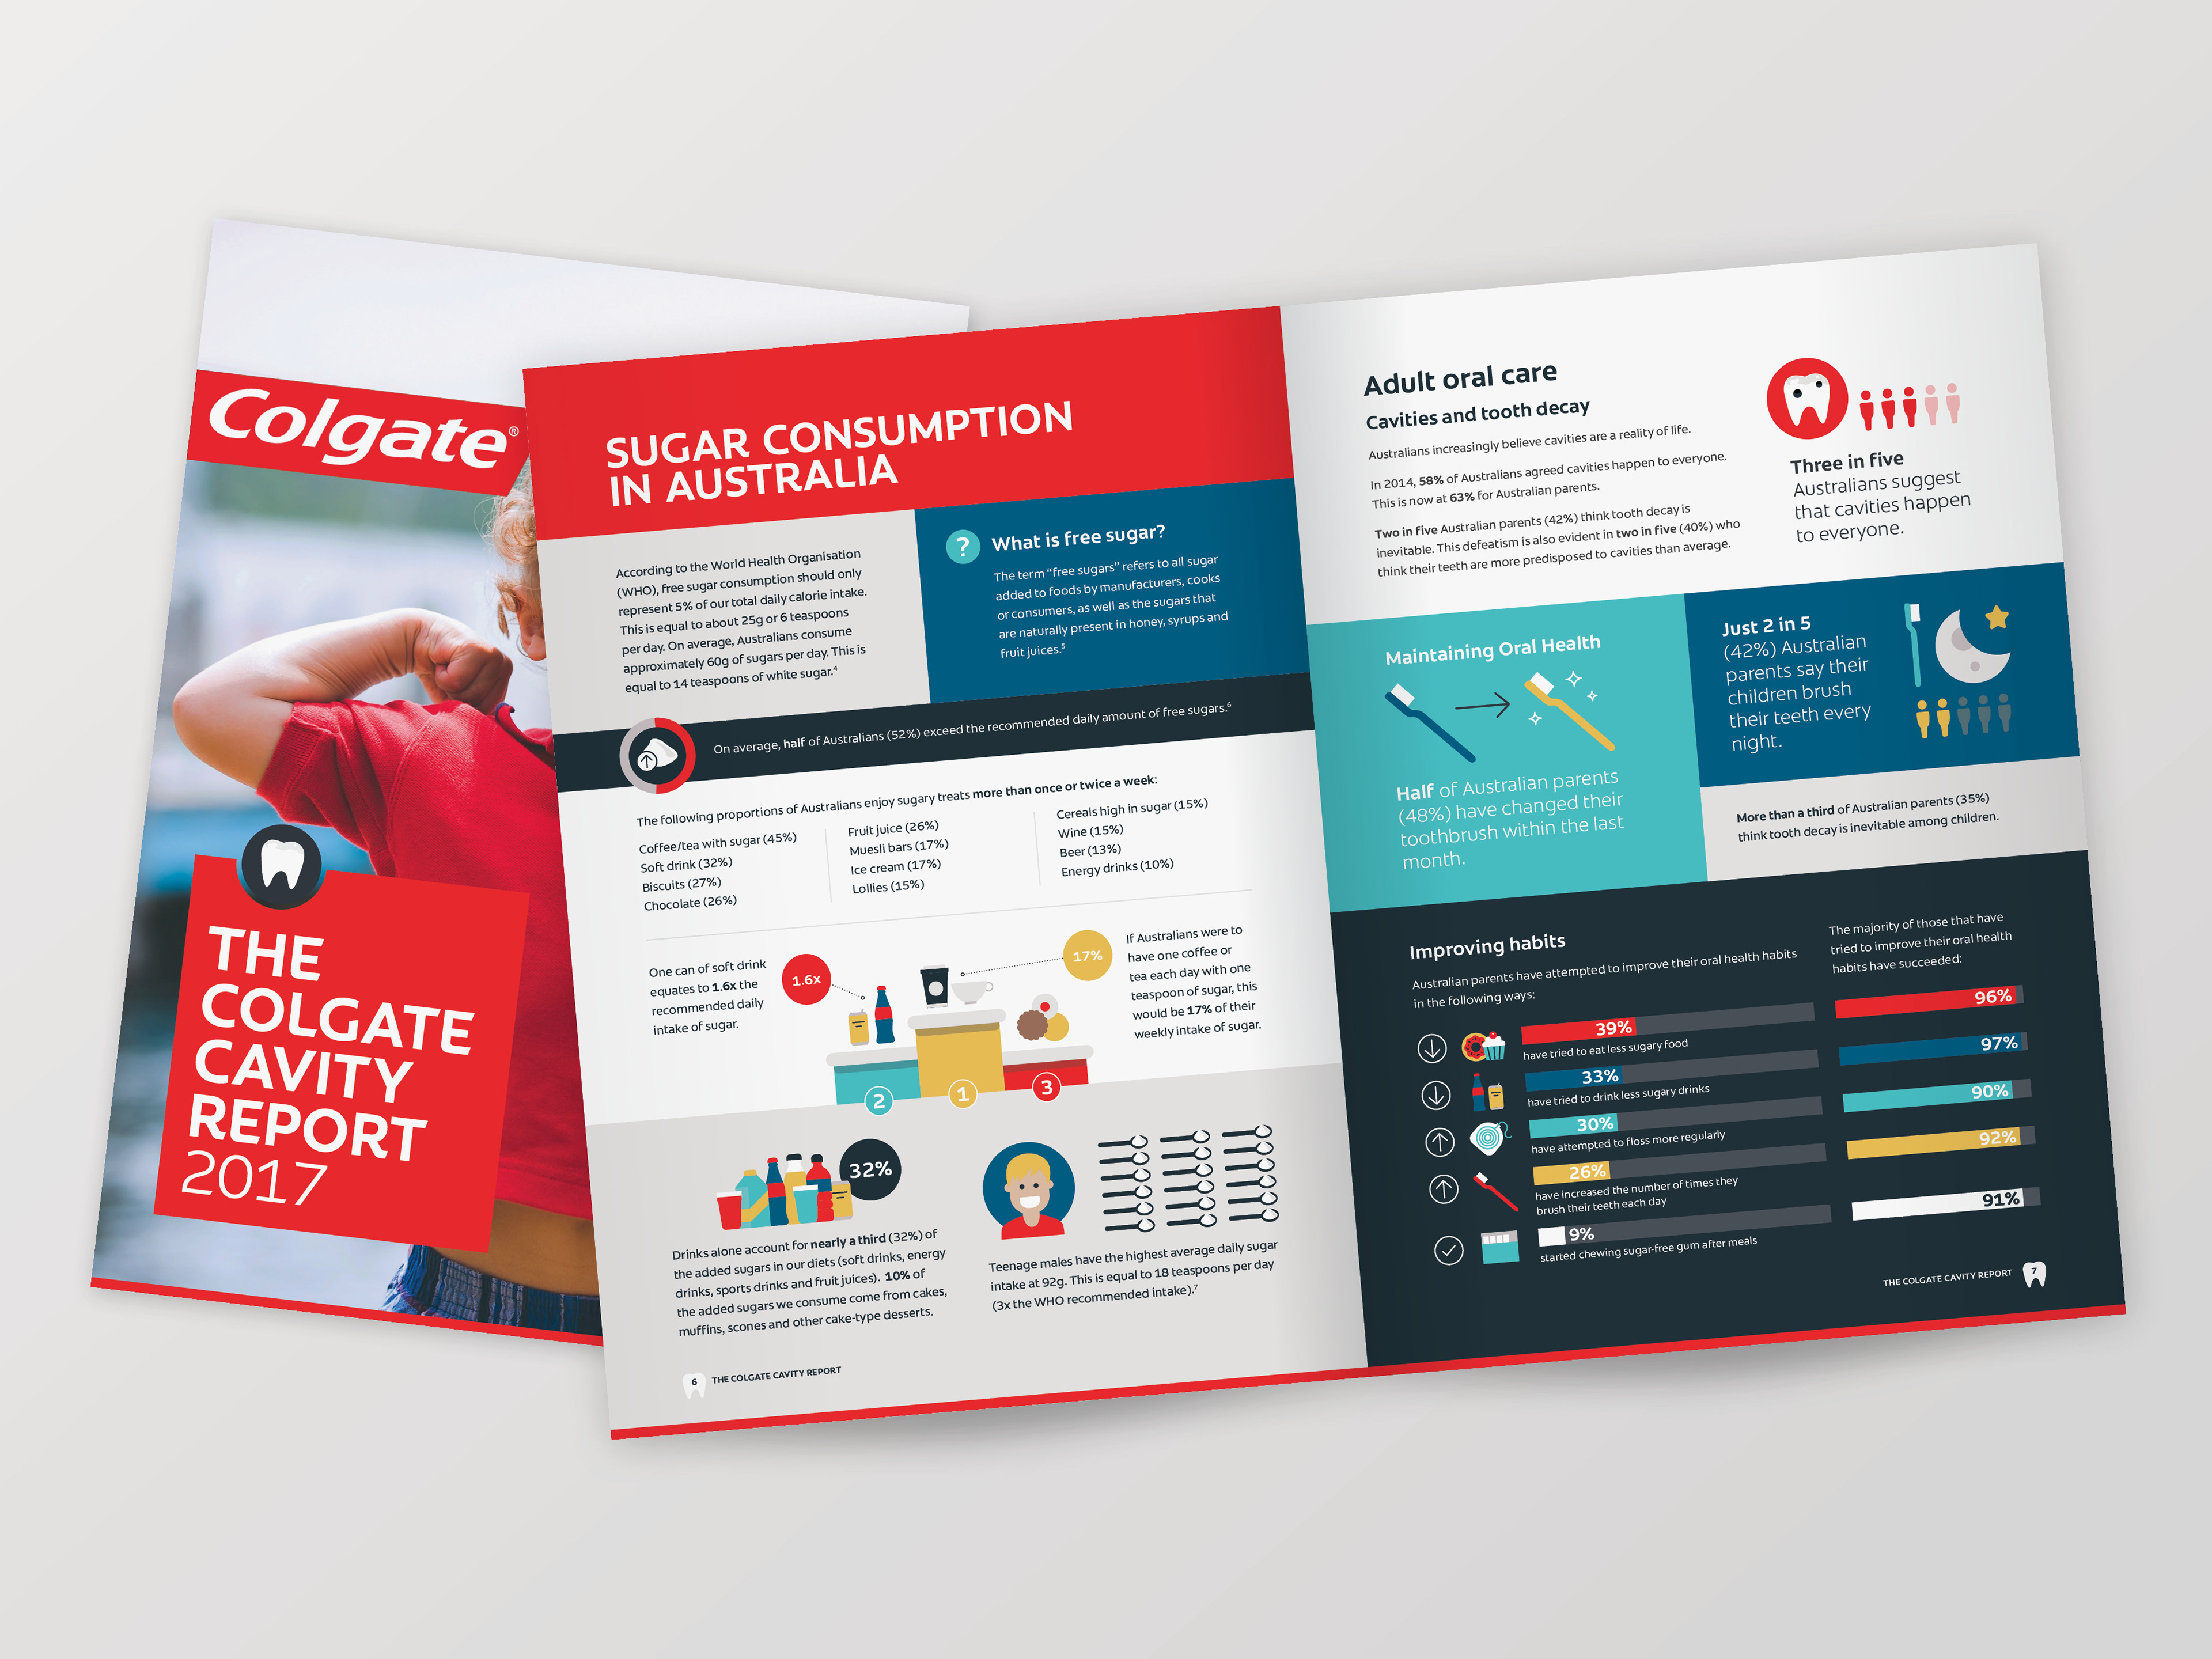
2 Colgate: The Colgate Cavity Report, 2017
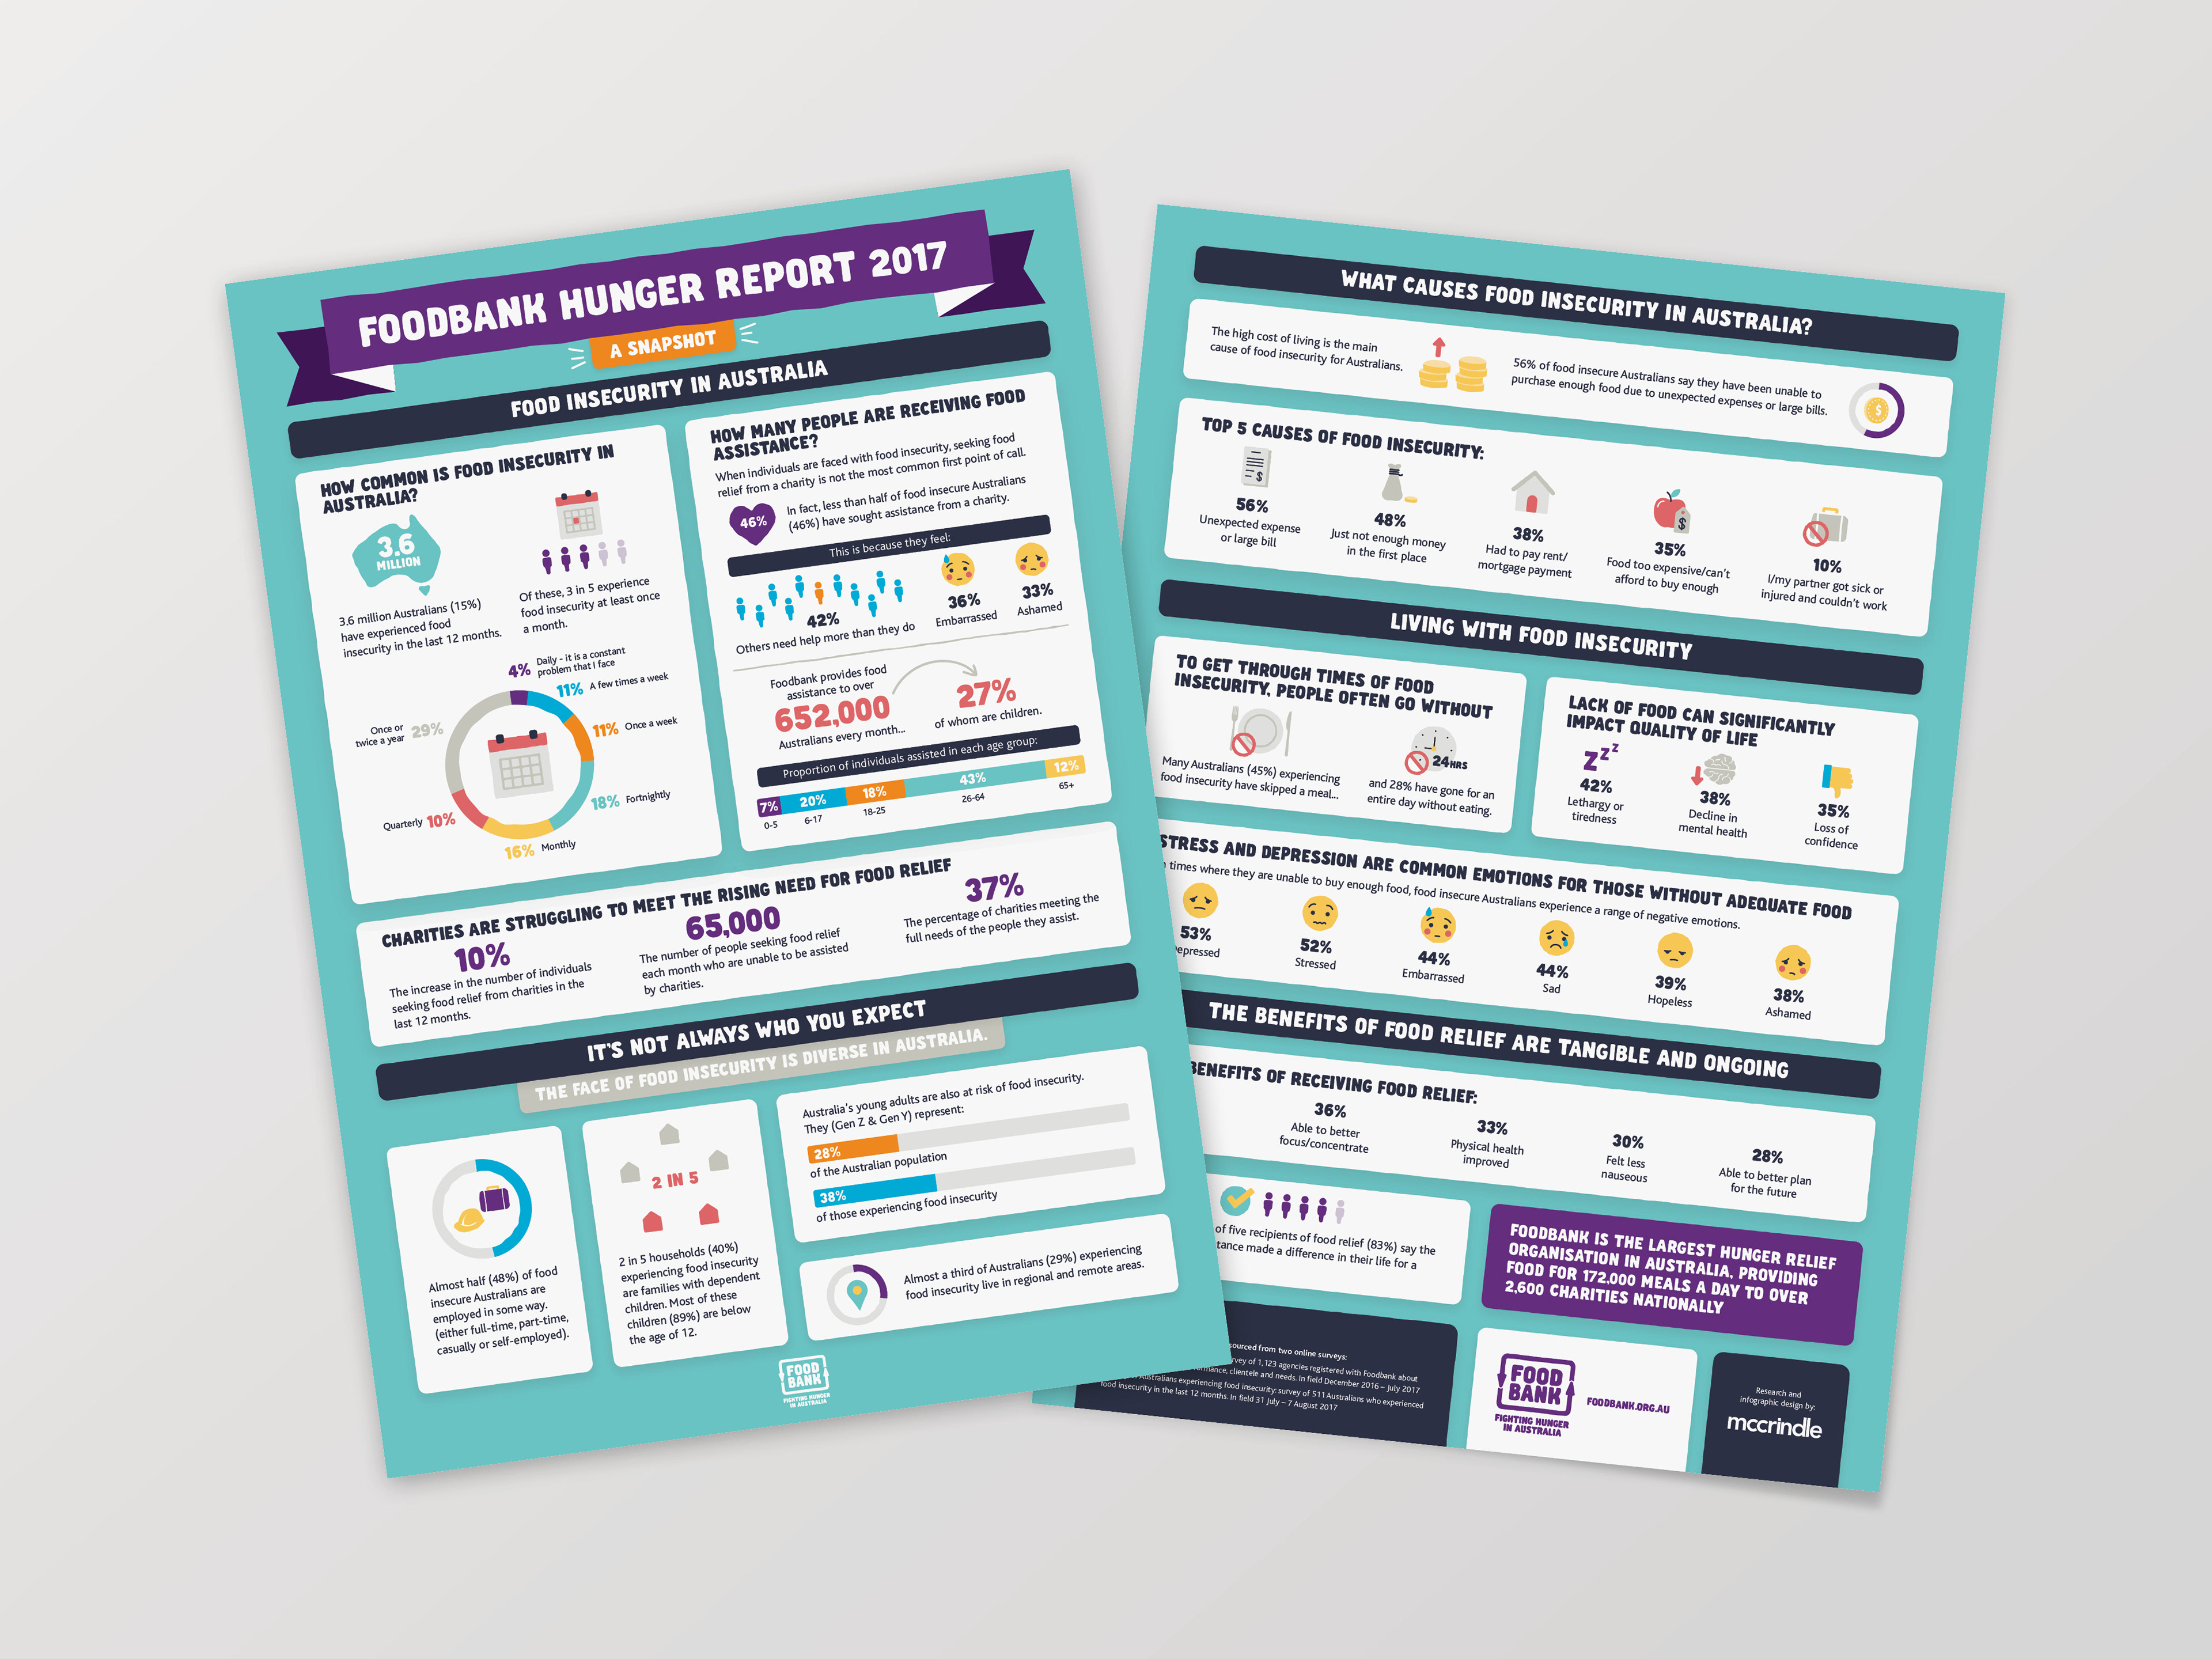
3 Foodbank: Hunger Report Snapshot, 2017
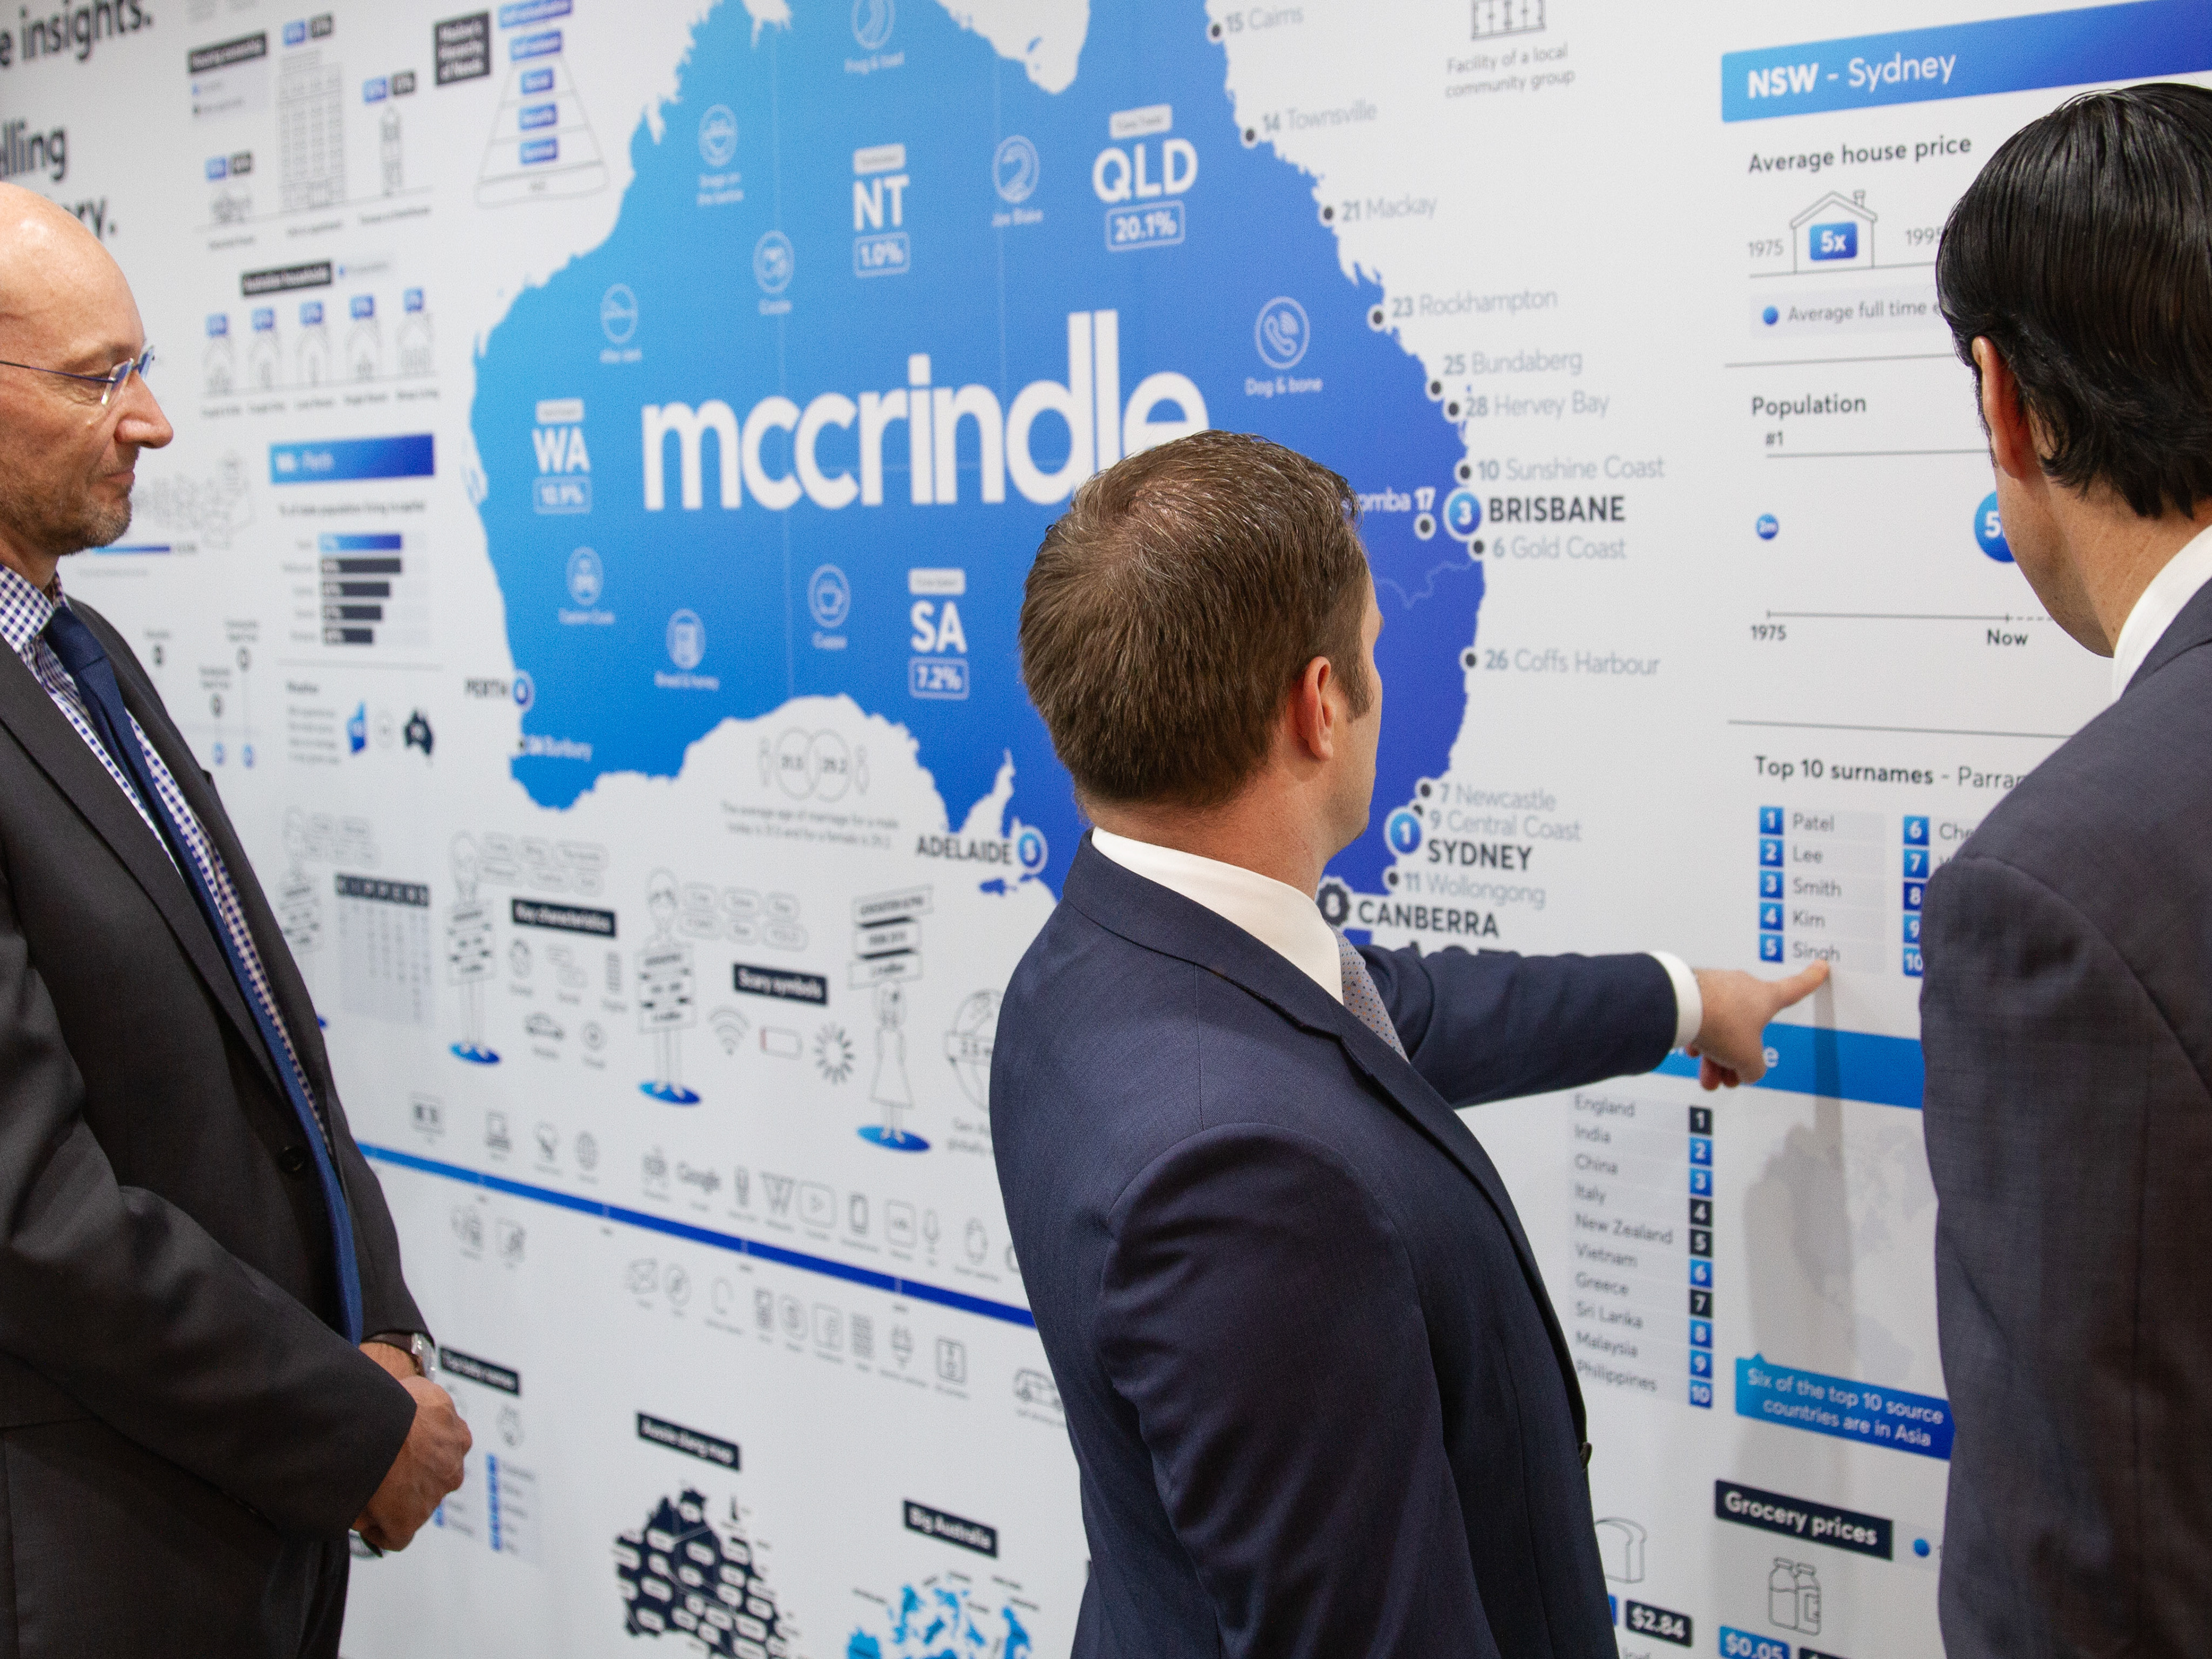
4 McCrindle: Office feature wall
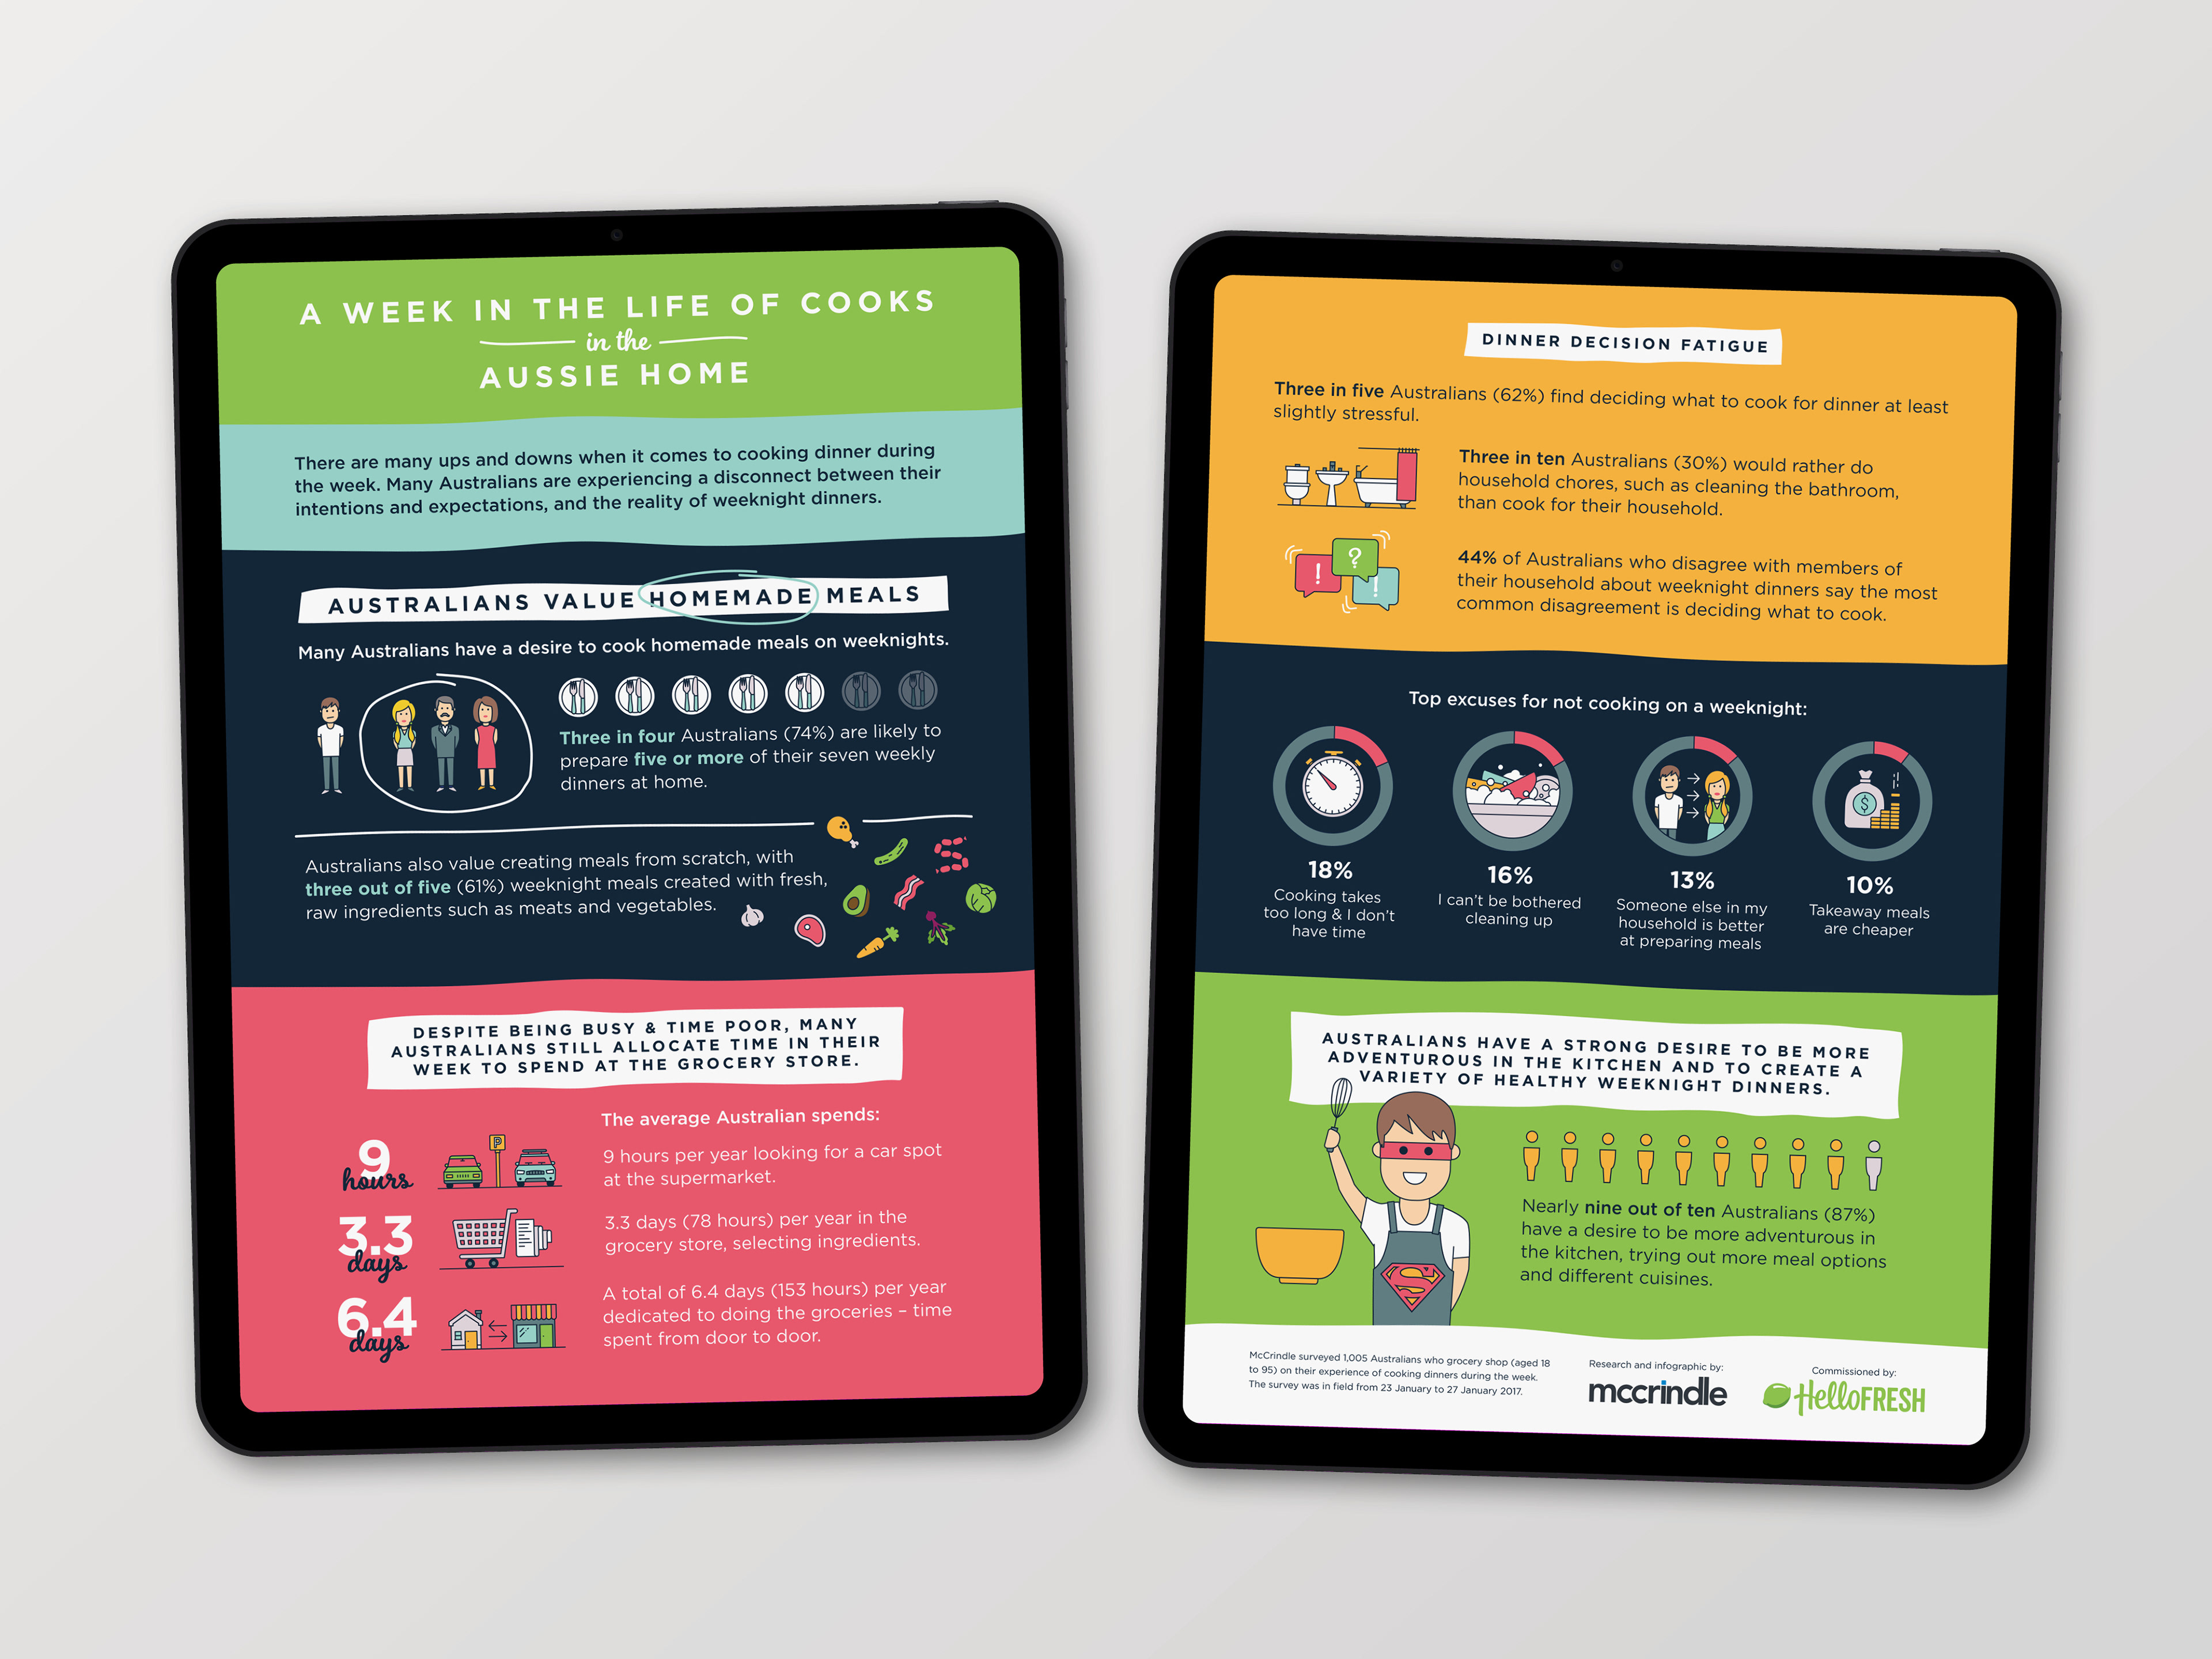
5 HelloFresh: Cooking in the Aussie home
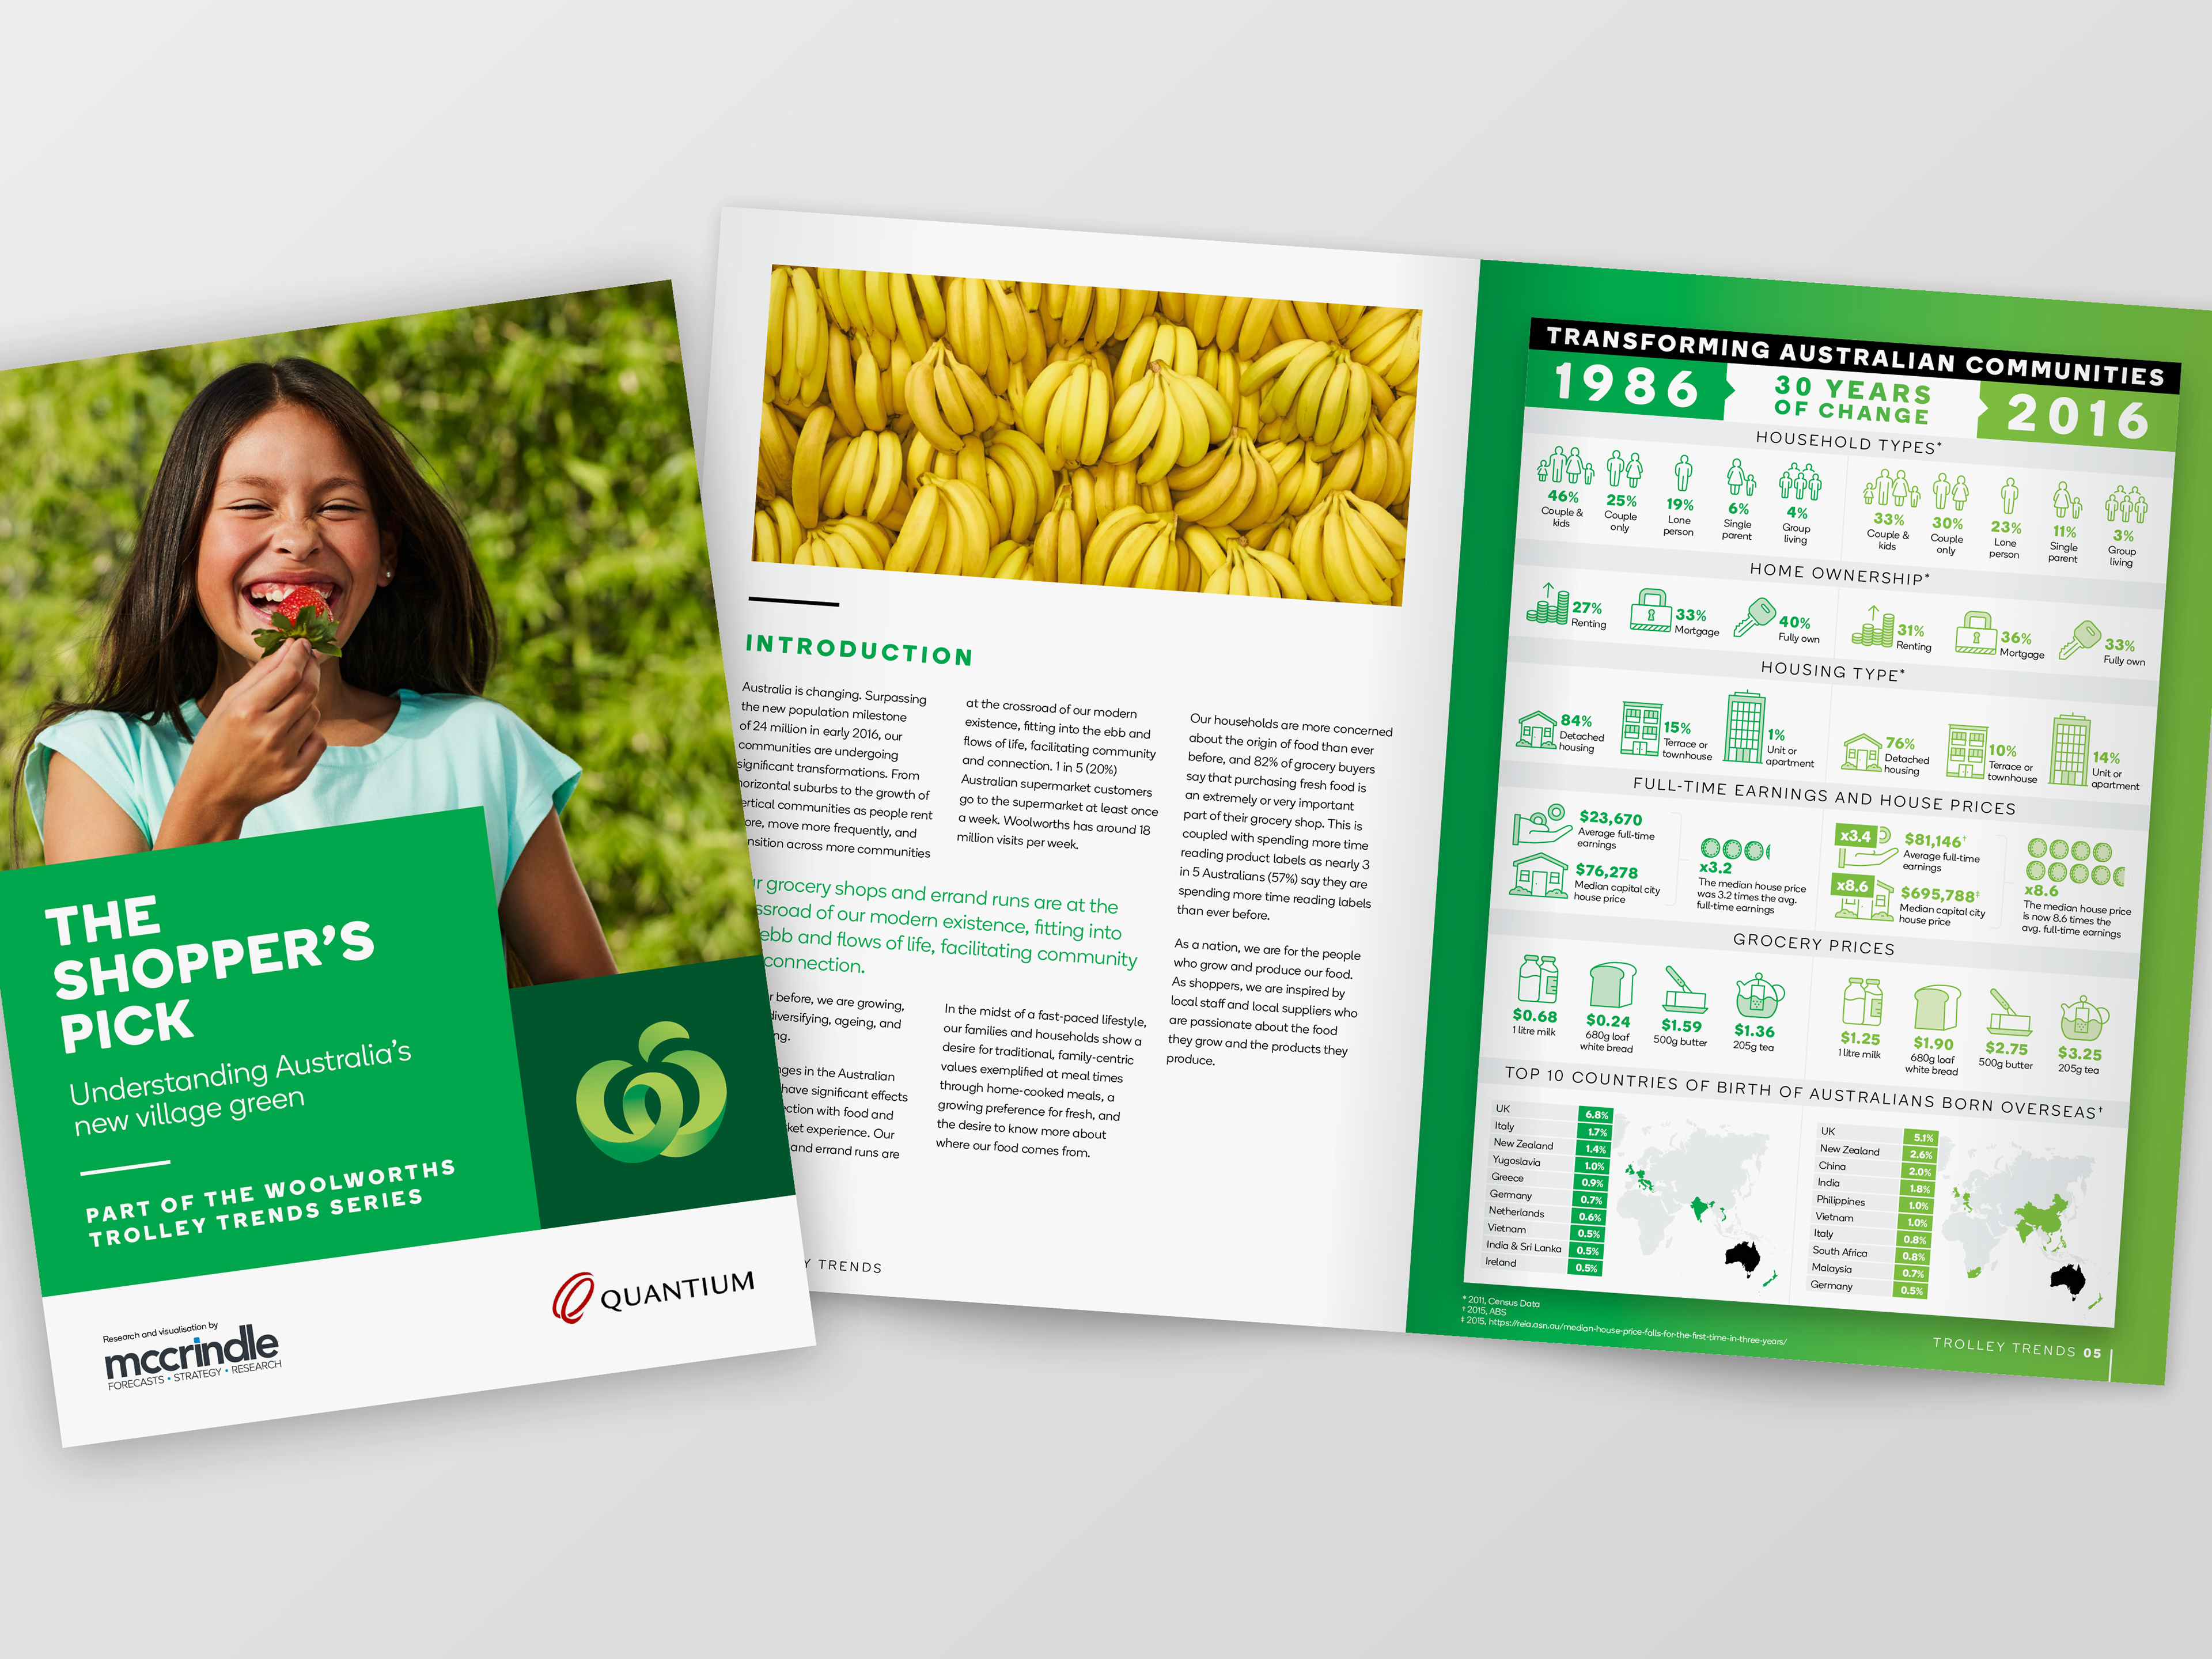
6 Woolworths: The Shopper's Pick, 2017